Introduction
In the digital age, a brand is no longer defined solely by what a company communicates about itself. Instead, it is shaped by what millions of people collectively believe it to be. These beliefs are expressed continuously through social media posts, product reviews, news coverage, and countless other digital interactions.
For organizations attempting to understand brand perception, this environment presents a fundamental challenge. The volume of available data is unprecedented, yet the signals it produces are often inconsistent and contradictory. Traditional research tools such as surveys and focus groups remain essential for measuring brand equity, but they capture perception only at specific points in time and cannot fully reflect the fast-moving nature of digital conversation.
At the same time, social media offers a continuous stream of public commentary, revealing how brands are discussed, interpreted, and compared in everyday discourse. However, these signals are noisy and difficult to interpret in isolation.
This tension motivated the development of a Brand Perception Atlas, designed to integrate diverse perception signals into a unified analytical framework. By combining social media data, public knowledge sources, Large Language Model (LLM) summaries, and established brand equity research, the atlas aims to provide a more comprehensive understanding of how brands are perceived across the digital ecosystem.
The first iteration of this project analyzed perception signals for more than 200 brands and over 4,000 individual data points, enabling the construction of a visual representation of brand perception that reveals relationships, consistencies, and divergences across multiple sources.
The Brand Perception Atlas
The Brand Perception Atlas functions as a navigational system for brand strategy, like how a satellite navigation map helps a pilot understand the terrain below. A pilot does not see individual roads or buildings from the cockpit. Instead, they rely on a map that reveals patterns, landmarks, and relationships across the entire landscape.
Brand leaders face a similar challenge. Individual data points, social posts, reviews, survey responses, are like isolated coordinates. On their own, they reveal very little. But when thousands of signals are plotted together, patterns begin to emerge.
The Brand Perception Atlas converts these signals into a shared perceptual map, allowing leaders to see how brands cluster, where they compete, and which meanings they occupy in the public imagination.
To achieve this, the atlas synthesizes perception signals from several sources:
- Content from official brand accounts on platforms such as TikTok and Instagram
- Public narratives reflected in sources like Wikipedia
- AI-generated summaries, using Gemini, describing how brands are perceived in digital discourse
- To anchor the analysis in long-term brand perception, the system incorporates survey-based brand equity data from the WPP Brand Asset Valuator® (BAV).
Figure 1 illustrates the Brand Perception Atlas and the different data sources used. By integrating these sources, the atlas creates a more holistic representation of brand perception than any individual data source can provide alone.

Figure 1: Data sources flowing into the Brand Perception Atlas
The actual data from our sensors for two of the world’s most recognizable brands, Target and Amazon, are outlined in Table 1. By presenting the actual reporting generated by each source, we can see how the Brand Perception Atlas bridges the gap between decades of structured consumer research and the lived experience of these brands in digital spaces.
| Sample Brand Perception Reports | ||
|---|---|---|
| Source | Target | Amazon |
| BAV Survey | ||
| (Long-term Equity) | “Consumers perceive this brand as a highly accessible and dependable choice, offering excellent value for money. It consistently earns praise for its reliable, high-quality, and original offerings… Seen as a dynamic leader that stays up-to-date and trendy.” | “Broadly perceived as an innovative and reliable leader, offering high quality and exceptional value. Consumers praise its distinctiveness and original thinking… It resonates with intelligent, forward-thinking individuals.” |
| Wikipedia | ||
| (public narrative) | “A major American retail chain… positioned as offering upscale products at below-average costs, appealing to a younger, more educated, and higher-income demographic… noted for its significant market presence.” | “Perceived as a global technology behemoth recognized for innovation and market leadership… However, its perception is tempered by persistent discussions regarding labor practices and its influence on traditional retail.” |
| Gemini LLM | ||
| (digital discourse) | “Target cultivates an ‘upscale-for-less’ reputation… It’s perceived as a clean, organized, and pleasant one-stop-shop that blends everyday necessities with trendy, affordable finds.” | “A study in contrasts, embodying both indispensable convenience and controversial corporate power. The vibe is one of a modern utility, deeply integrated into daily life, often viewed as a ‘necessary evil’.” |
| (brand official account) | “An accessible and enjoyable retail destination… The playful and organized presentation of shopping reinforces a positive, discovery-driven customer experience, emphasizing Target’s ability to host unique product lines.” | “Viewed as an essential, incredibly convenient, and reliable platform offering immense selection with unparalleled speed. Users celebrate its efficiency while simultaneously expressing a desire for greater focus on ethical concerns.” |
| TikTok | ||
| (brand official account) | “Widely seen as a trendy, accessible retailer offering stylish, curated products and collaborations that enable a joyful lifestyle… captures a highly visual and energetic side of the brand.” | “Projects a vibe of convenience, accessibility, and an expanding reach into curated wellness and lifestyle products… making niche, high-quality products feel easily attainable.” |
Table 1: Sample brand perception reports, for Target and Amazon, from the Brand Perception Atlas dataset
Developed by WPP, BAV is one of the largest and longest-running brand equity research programs in the world, with data collected over more than three decades across thousands of brands and markets. Unlike social media and digital sources, which provide indirect signals by analyzing what people post or what algorithms curate, BAV is survey-based and taps directly into human sentiment. By asking consumers directly, it captures deep-seated beliefs through structured imagery attributes such as innovative, reliable, and trustworthy.
Within the Brand Perception Atlas, BAV serves as the foundational benchmark. It represents the long-term equity and established identity of the brand, providing a stable baseline against which the more volatile, “everyday” signals of social media can be compared. This distinction is crucial: while social media shows what people are talking about today, BAV reveals what they fundamentally believe about the brand.
To provide a granular view of brand personality, the BAV system evaluates each brand against a standardized set of 48 Imagery Attributes. These attributes are the “building blocks” of perception, ranging from functional traits like Reliable, High Quality, and Simple to emotional and aspirational markers such as Charming, Daring, and Sensuous. By measuring a brand against this consistent list, the system can pinpoint exactly where its personality “peaks”, whether it is anchored in the “sturdiness” of a traditional leader or the “energy” of a modern disruptor.
In the Brand Perception Atlas, these 48 attributes act as a high-resolution lens. Rather than simply stating a brand is “liked,” the data reveals the specific nuances of why it is liked. For example, a brand may score highly on Intelligent and Visionary while scoring low on Friendly or Down to Earth. This multidimensional data allows the Atlas to plot brands with extreme precision, identifying “perceptual neighbors” who share the same underlying DNA across these 48 distinct dimensions of human sentiment.
Mapping Brand Perception
At the center of the Brand Perception Atlas lies the Perception Map, a visual representation of how brands relate to one another in terms of public perception.
Each perception signal is converted into a numerical representation of semantic meaning, known as an embedding. It is helpful to think of semantic meaning as the “vibe” or “essence” of a word, rather than just the word itself. In a traditional search, if you looked for “Luxury,” a computer might ignore a result for “High-end” because the letters don’t match. However, the Brand Perception Atlas uses semantic embeddings to understand that “Luxury,” “Premium,” and “Prestigious” all mean roughly the same thing. Because their meanings are similar, the system places brands described with these words in the same neighborhood on the map. It maps the ideas behind the words, not just the text.
This semantic translation approach is shared across the Satalia AI Research Lab. The Ad Performance Pod applies a complementary technique, using multimodal LLMs to convert raw ad creatives, images, video, and metadata, into structured text descriptions, and then predicting post-level engagement from those descriptions. Where the Atlas asks “what does this brand mean?”, the Ad Performance Pod asks “what makes this content perform?” — both relying on the principle that rich semantic embeddings can unlock patterns invisible to traditional feature engineering.
These embeddings are then plotted within a shared space. In this space, the distance between points reflects the similarity of the associations surrounding different brands. Brands with similar perceptions appear close together, while those associated with different ideas occupy distinct regions.
The resulting map resembles a landscape of brand meaning, allowing brand leaders to observe clusters of brands that share common associations and identify outliers that occupy unique perceptual positions.
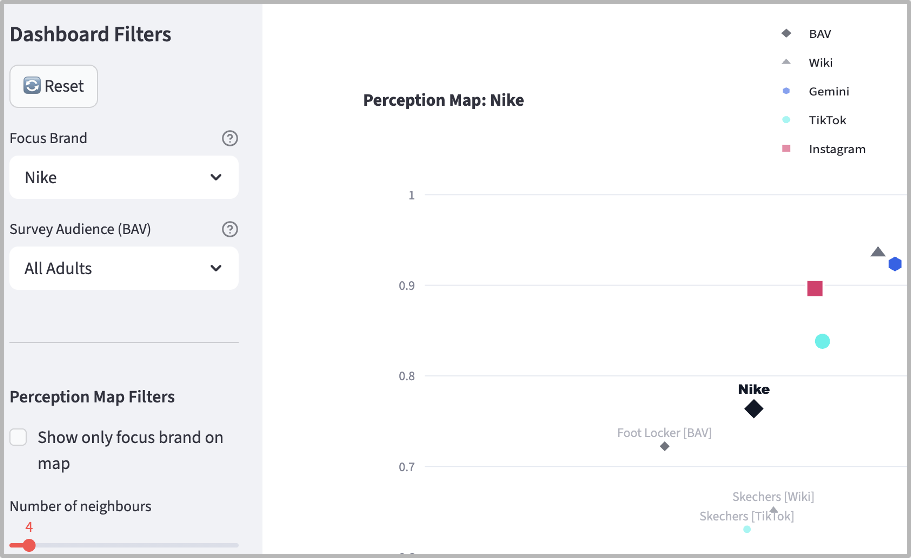
Figure 2: Perception map for Nike across all platforms (US, 2025-26)
When a brand is selected within the Perception Map interface, as shown in Figure 2, the system reveals a rich, multi-layered profile that visualizes how that brand lives in the public imagination. The interface acts as a command center, surfacing the distinct signals captured by each sensor to provide a 360-degree view of the brand’s identity.
Once a brand like Nike is selected, the map highlights its specific coordinates across all platforms, while the sidebar populates with synthesized insights including the brand’s industry, country, and a “Cluster Label”, for example “Hope Innovation Compassion”, which summarizes the overarching sentiment. Users can navigate the Perception Signal Summaries to see the unique reports for each platform, from the foundational BAV sentiment to real-time narratives on TikTok and Instagram, allowing for an immediate comparison of how the brand “sounds” in social discourse versus how it is “valued” in long-term surveys.
Insights from the Unified Perception Map
Once the perception spaces were aligned, several patterns became visible:
- Omnichannel Consistency (Unified Brands): These brands have the most “clustered” perception signals, meaning they look the same regardless of which sensor you use vs Heterogeneous Perception (Diverse Brands): These brands are “dispersed”, they present different facets of their identity depending on where you look.
- Shared Equity, Different Vibe (Close on BAV, Far on Socials): These brands share deep-seated consumer beliefs but look different on TikTok/Instagram.
- Different Equity, Shared Vibe (Far on BAV, Close on Socials): These brands come from different worlds but converge into a single “vibe” in the public imagination.
- Invisible Infrastructure Brands: These foundational entities occupy a shared emotional territory of essentiality and high-stakes reliability, despite having radically different levels of public visibility.
These insights demonstrate the value of examining brand perception across multiple data sources rather than relying on any single indicator.
Omnichannel Consistency (Unified Brands) vs Heterogeneous Perception (Diverse Brands)
One of the most useful insights derived from the perception map is a metric we refer to as Omnichannel Consistency. This measure evaluates how closely aligned a brand’s perception is across different information sources. If the signals derived from social media, surveys, and public narratives cluster tightly together, the brand is communicating a coherent identity. Conversely, if these signals are widely dispersed, the brand’s presence is more diverse.
Analysis of the dataset revealed several brands with particularly strong consistency across channels, including John Deere,Caterpillar, and Oscar Health, with over 99% omnichannel consistency.
John Deere serves as the definitive benchmark for Omnichannel Consistency, maintaining one of the most stable identities in the Brand Perception Atlas. While many brands act like chameleons, shifting their personality to mirror the fleeting trends of each platform, John Deere operates as a perceptual anchor, where its core essence of “rugged reliability” remains unchanged whether viewed through a 30-year longitudinal BAV survey or a viral TikTok demonstration. Figure 3 demonstrates this pattern, showing all of the John Deere data points close together on the map.

Figure 3: Perception map showing high omnichannel consistency for John Deere on all platforms (US, 2025-26)
This “Nothing Moves Like a Deere” factor is so powerful that even complex public debates, such as the “Right to Repair” controversy, appear with remarkable alignment across all five sensors, reinforcing the brand’s status as an essential, high-stakes infrastructure provider for its community. For leadership, this proves that a sufficiently clear perceptual identity pulls every digital channel toward a single, unified truth.
As shown in Figure 4, the brand’s actual digital content reinforces this stability by bridging the gap between historical heritage and modern utility. The Brand Perception Report for this specific Instagram post highlights a reputation for “practical innovation,” where powerful, reliable machinery transforms arduous tasks like snow removal into efficient, even enjoyable endeavors. The data reveals a narrative centered on problem-solving and the ultimate reward of reclaimed time, positioning the brand as a premium, aspirational solution. While the content emphasizes the ease of machine efficiency over manual labor, it also subtly reflects the “significant investment” required for such equipment, a sentiment that aligns perfectly with the “rugged yet refined” and “worth more” attributes captured by the BAV survey sensors.
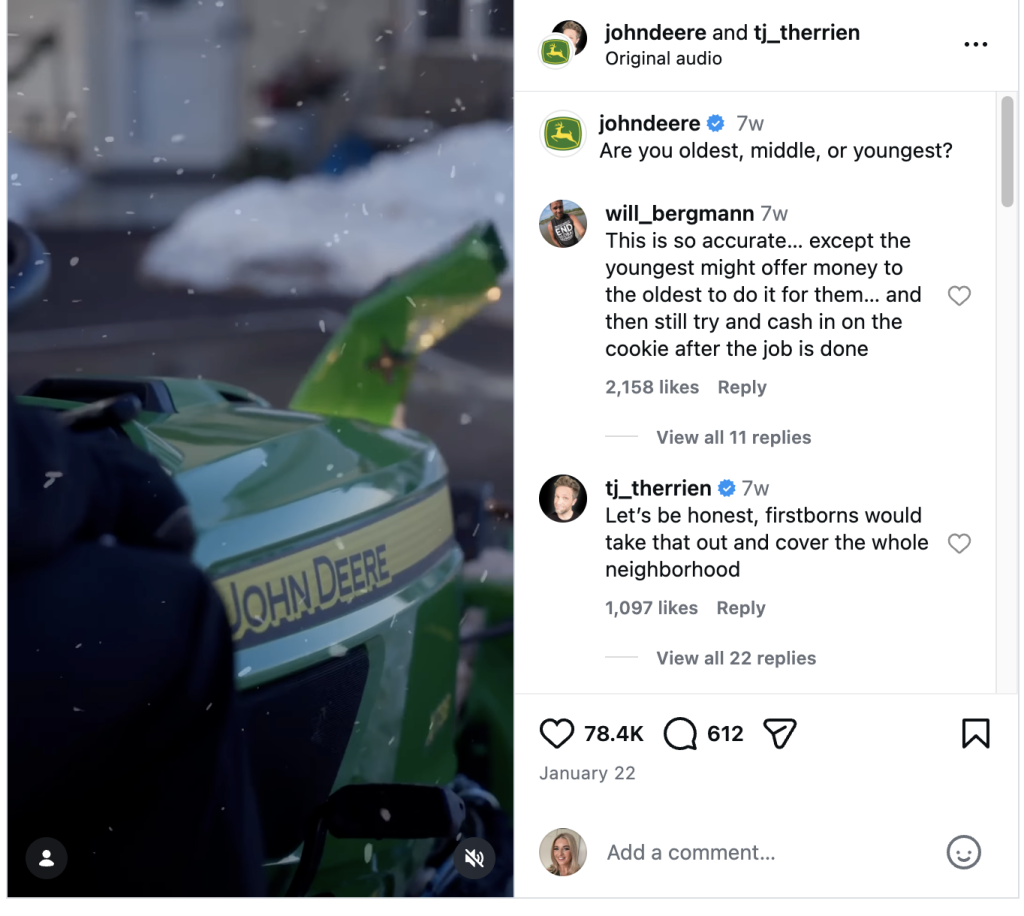
Figure 4: Screenshot of a John Deere Instagram video showing snow removal equipment
In contrast, several brands demonstrated much greater variation in perception across sources. These included Marriott, Southern Living, and American Airlines, whose signals appeared more widely distributed across the perception map.
Marriott provides a contrasting example of a multi-faceted brand that successfully occupies distinct perceptual regions depending on the sensor used. The BAV sensor positions the brand within a territory of reliability, superior quality, and prestigious appeal, where consumers fundamentally view Marriott as an intelligent, high-performing, and traditional leader. However, the social sensors (Instagram and TikTok) pull the brand into a separate region defined by aspirational luxury and curated escapism. In these digital spaces, Marriott’s intended portrayal is human-centric and inclusive, with official reports describing an organization that “champions individuals” and demonstrates “deep cultural understanding.” This is brought to life through actual content featuring stories of people, such as the one shown in Figure 5, an Instagram post highlighting Chef Kashif Khan using sign language to communicate at the St. Regis Mumbai. This mapping is diagnostic for leadership, revealing that Marriott is not a monolith; it is a reliable corporate giant that strategically uses social media to humanize its identity through stories of diversity, sustainability, and global connection.
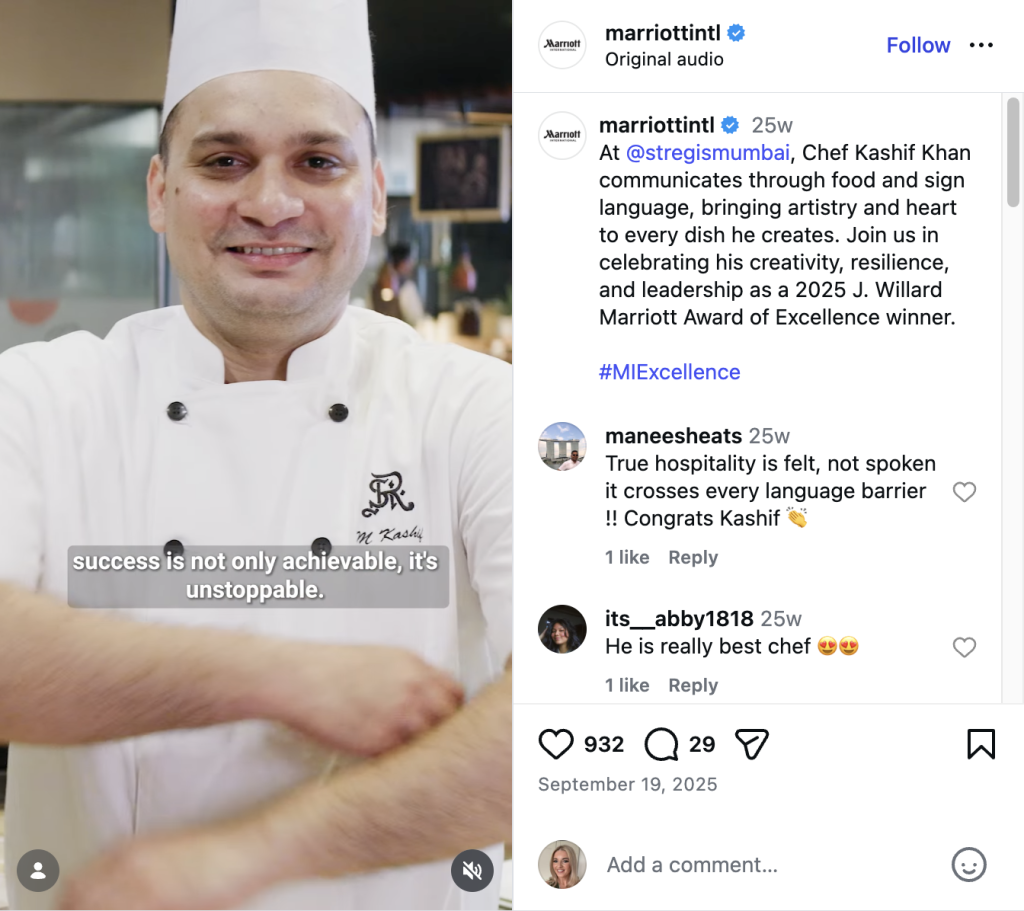
Figure 5: Screenshot of the Instagram video of Chef Kashif Khan using sign language
Interestingly, multiple travel-related brands appeared in this lower-consistency group. The high volume of online discussion surrounding travel experiences, ranging from positive stories to customer complaints, may contribute to a more fragmented perception environment for brands in this sector.
Perhaps the most critical lesson our dashboard taught us is that online buzz doesn’t automatically change what people fundamentally believe about a brand. Social media is a powerful megaphone, but it’s not always a mind-changer. It is easy to be distracted by conversation volume and the sheer amount of noise, visibility, and viral activity a brand generates on platforms like TikTok or Instagram. However, the Atlas looks past this “digital footprint” to uncover a brand’s equity: the deep-seated associations that define how a brand is understood by the public. When we look at these deeper signals, brands that seem worlds apart on social media often turn out to be close neighbors in the mind of the consumer.
The perfect case study for this is Palo Alto Networks, a titan in the cybersecurity industry.
If you were to judge them solely by their Instagram presence, you’d see a flawless picture of a market champion. The conversation is filled with words like “Reliable, Innovative, Leader.” It’s a polished, professional, and highly positive image, the brand broadcasting its strengths and amplifying its message of leadership.
But our BAV data, the “ground truth” of long-term brand equity, built from years of customer experiences and market reputation, tells a more complicated story. The BAV data agrees on their high status, describing them as “Intelligent” and “Prestigious.” However, it adds a critical, and very human, third dimension: “Arrogant.” This single word is the key. The perception of “arrogance” isn’t something a few Instagram posts can erase. It’s a feeling built from countless interactions: sales calls, pricing negotiations, customer support tickets, and industry chatter. It’s a core part of their brand’s DNA, for better or worse.
What the map shows is that the high volume of positive conversation on Instagram is successfully amplifying the “Leader” and “Innovative” message. However, it hasn’t fundamentally altered the deep-seated perception of arrogance. The social media buzz is happening on the surface, while the core brand equity, the good and the bad, remains firmly in place. It’s a powerful reminder that you can’t just tweet your way to a new reputation.
In other words, social media can amplify a reputation, but it rarely rewrites it.
For leadership, this mapping is diagnostic, offering a clear view of whether this dual identity represents a successful multi-segment strategy or an unintended drift from the brand’s core promise.
It is important to note that omnichannel consistency is not inherently positive or negative. Some brands benefit from a tightly aligned identity across all platforms, while others thrive precisely because they present different facets of themselves in different contexts. For example, entertainment, fashion, and travel brands often generate highly diverse narratives online, reflecting the variety of experiences consumers have with them. In these cases, perceptual fragmentation may actually be a sign of adaptability and cultural relevance.
The value of the metric is therefore diagnostic rather than prescriptive. It reveals where a brand sits on the spectrum between a unified or multi-faceted perception ecosystem, allowing leaders to determine whether that specific pattern aligns with their strategic intent. For some, a tightly clustered, unified identity is the goal; for others, a more distributed, multi-faceted presence across different platforms is a deliberate strategy to reach diverse audiences.
Shared Equity, Different Vibe (Close on BAV, Far on Socials)
The Atlas also reveals unexpected relationships between brands that operate in entirely different industries. The most striking examples of the “Perception Paradox” occur when two brands share an identical equity backbone but present entirely different faces to the digital world.
Consider 3M, (originally the Minnesota Mining and Manufacturing Company) a global diversified technology conglomerate that applies material science to develop over 60,000 products for industrial, worker safety, healthcare, and consumer markets. At its core, 3M functions as a science-driven “innovation engine.” The company is famous for its “15% Rule,” which allows employees to spend a portion of their time on passion projects, a culture that famously led to the invention of the Post-it Note.
Then consider Marriott, a premier global hospitality company that operates, franchises, and licenses a vast and diverse portfolio of hotels and lodging facilities.
On social media, these brands live in completely different worlds. 3M’s presence is defined by science and industrial innovation, while Marriott trends through a lens of “aspirational luxury” and global travel. If you judge only by social footprint, you would assume these brands occupy different cultural spaces; indeed, on social sensors, they move to opposite ends of the map, as 3M focuses on the mechanics of research and Marriott on the spirit of leisure.
Figure 6 illustrates this social-layer distinction for 3M. This video is just one example of the content driving an overall Instagram vibe characterized as Innovative, Responsible, and Sustainable. The brand perception report for this post captures an aspirational narrative of “innovation, education, and community.” By highlighting initiatives like the “3M Young Scientist Challenge,” the brand is perceived as a champion of scientific exploration, fostering a “fun” and “inspiring” platform for young people to solve real-world problems. While this specific content positions 3M as a driver of STEM education, the Atlas reminds us that beneath this vibrant digital layer lies the same sturdy, reliable identity that makes it a perceptual neighbor to a hospitality giant like Marriott.
However, when we look at the BAV sensor, they appear as surprisingly close neighbors. The reason becomes clear when you look at the deeper associations: both brands are anchored by Reliability and Leadership. In the foundational mind of the consumer, 3M is an “innovation backbone,” while Marriott is a “service backbone.” While their social streams look nothing alike, their underlying brand equity is rooted in being an essential, dependable institution.
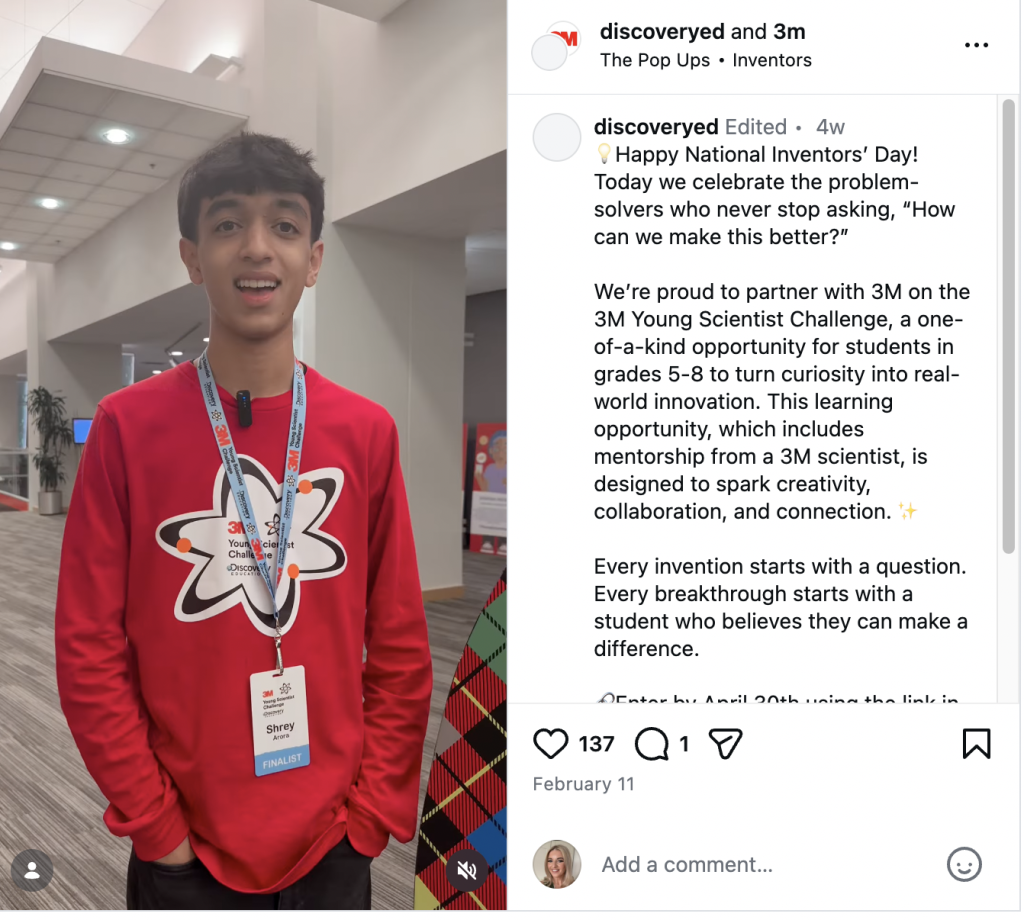
Figure 6: Screenshot of 3M Instagram video highlighting the Young Scientist Challenge
Now, consider Costco, a warehouse retailer known for bulk purchasing, and JetBlue, a major passenger airline. At first glance, these brands share little in common; however, when we look at the BAV sensor, they emerge as close neighbors within a shared “Consumer Champion” territory.
On BAV imagery attributes, both brands are anchored by a core identity of being Friendly and Reliable. Costco is fundamentally perceived through a lens of Simplicity, while JetBlue is defined by its Value. In the foundational mind of the consumer, both brands occupy a similar emotional space: they are the “trusted alternatives” that provide high-quality essential services without the exploitative friction often associated with their respective industries.
As shown in Figure 8, the interface allows us to see how these signals diverge as we move into the “Experience Layer” of social media. On Instagram, Costco remains tightly aligned with its BAV profile, with its digital presence reinforcing a narrative of affordability and value for money. JetBlue, however, shifts into a more aspirational territory on social platforms, emphasizing convenience and the lifestyle of travel.
Figure 7: Screenshot of the Brand Perception Atlas showing Costco and JetBlue, with Costco selected as the focus brand
This distinction is diagnostic for brand leaders. It shows that while two brands may share an identical “equity backbone” as consumer champions, their social expressions can vary significantly based on platform context, Costco doubling down on its “no-frills” value while JetBlue leans into the aspirational allure of the journey.
The result is that two brands from entirely different industries converge within the same emotional territory: brands that make consumers feel smart, respected, and well served.
Different Equity, Shared Vibe (Far on BAV, Close on Socials)
The Brand Perception Atlas also reveals an inverse pattern: brands that come from entirely different industries and share almost no long-term equity, yet converge into a single, unified “vibe” on social media. In these cases, the social layer acts as a cultural blender, pulling disparate corporate giants into the same neighborhood.
Fox is a major American media conglomerate primarily known for its television broadcasting, news, and sports programming. It operates the Fox Broadcasting Company, Fox News, and Fox Sports. Its identity is built on high-stakes live events, character-driven drama, and real-time news reporting—a business that naturally scores high on “Dynamic” and “Charming” attributes but often generates polarizing sentiment.
Kimberly-Clark is a global giant in personal care and hygiene products. It manufactures essential household brands such as Huggies diapers, Kleenex tissues, Cottonelle toilet paper, and Kotex feminine hygiene products. Its business is rooted in high-volume manufacturing and daily utility, leading to a long-term reputation for “Reliability” and “Practicality” that is very different from the world of mass media.
When we look at the BAV sensor, Fox and Kimberly-Clark are worlds apart, with a distance. Fox is perceived through a lens of high-stakes entertainment and sophistication, scoring highly on attributes like Charming, Sensuous, and Dynamic. Kimberly-Clark, meanwhile, is anchored in the “Practical Utility” of household essentials, defined by Reliability, Quality, and Trustworthiness.
Figure 8: Screenshot of the Brand Perception Atlas showing Fox and Kimberly-Clark, with Fox selected as the focus brand
To the average consumer, a polarizing media giant and a dependable tissue manufacturer should share no common ground. However, as shown in Figure 10, the Social Sensors reveal a convergence. On Instagram and TikTok, the distinction between a news broadcast and a household utility fades as both brands pivot toward lifestyle-centric storytelling.
According to the social reports, Fox is perceived through a lens of “intense, character-driven drama” and high-stakes emotional depth, appealing to those who value mature storytelling. Simultaneously, Kimberly-Clark’s social presence is described as “authentic and engaging,” characterized by a “vibrant” and “charismatic” brand presence that uses humor and social commentary to create a “deeper connection beyond entertainment.” In this digital layer, Fox’s dramatic clips and Kimberly-Clark’s community-focused narratives occupy the same neighborhood. They are no longer judged as “The News” vs. “The Diaper Company”; instead, they are unified as Established Lifestyle Entities that use high-quality content to build emotional resonance with their audiences.
Invisible Infrastructure Brands
The Atlas also reveals a unique category of brands that operate as “Invisible Infrastructure.” These are entities that sit at the center of the perception map not because they are famous, but because they are foundational. One striking example is the proximity of Pfizer and Kyndryl.
Kyndryl is one of the world’s largest IT infrastructure services companies, spun off from IBM in 2021. It manages the mission-critical technology backbone for hospitals, banks, airlines, and governments around the world. Most consumers have never heard of its name. Its revenue is enormous; its consumer presence is almost zero. And yet, in our perception map, it sits directly next to Pfizer.
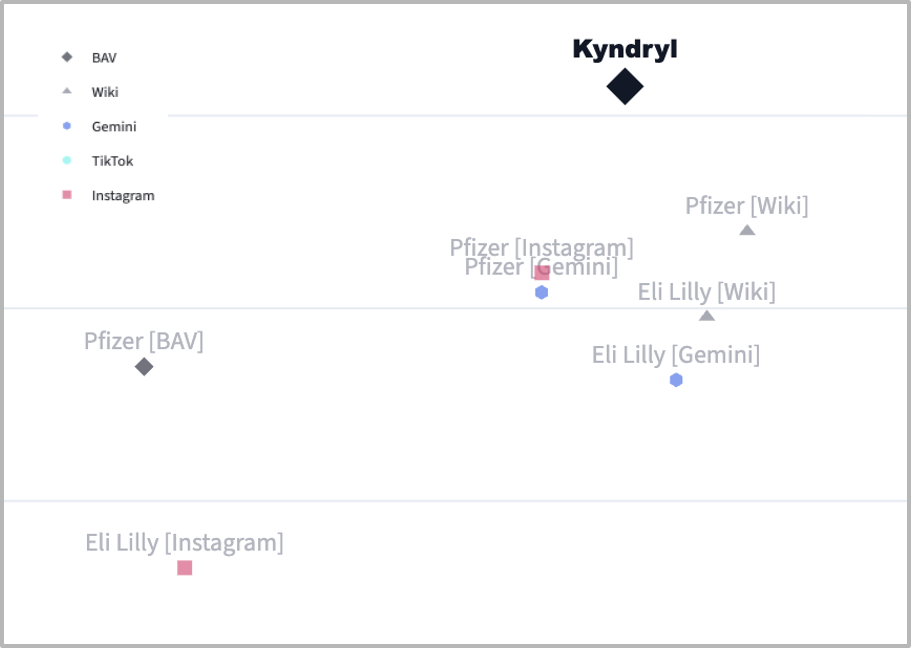
Figure 9: Screenshot of the Brand Perception Atlas showing Kyndryl and Pfizer, with Kyndryl selected as the focus brand
On the BAV survey, both brands score highly on imagery such as intelligent, reliable, progressive, and original, placing them far from lifestyle or aspirational brands. The depth of the BAV dataset further reveals that this “Expertise” profile is universally recognized across demographics. For example, both Male and Female audiences consistently identify these brands as Visionary and High-Performance leaders, regardless of their personal familiarity with the company’s day-to-day operations. Despite radically different visibility levels, they share the same underlying promise: critical systems do not fail because of us. Kyndryl has no social media presence. Post-Covid, Pfizer is perceived as controversial on Wikipedia and Gemini.
Kyndryl, a brand name most consumers don’t recognise, sits directly next to one of the world’s most recognised pharmaceutical giants in perception space. Not because they sell similar products, but because they occupy identical emotional territory: the invisible infrastructure of modern life that you only notice when it fails. The data from our sensors provides strong evidence for this “Invisible Infrastructure” connection between Pfizer and Kyndryl. Despite their radically different levels of public fame, they share a distinct perceptual fingerprint. When we look at the BAV data, the reason for this proximity becomes clear. Both brands are anchored by attributes associated with competence and essentiality rather than lifestyle appeal.
The Gemini sensor perceives Kyndryl as a “Powerful and Reliable” entity that provides the backbone for critical systems. The report emphasizes its “indispensable” nature to global commerce. Pfizer, while highly recognized, is described as a “polarization” where the brand is viewed as a “scientific savior” clashing with a “profit-driven corporate giant.” The Wiki and Gemini and reports specifically mention it is a “Big Pharma” entity whose “trust is a highly contested issue.”
Even though one is a household name and the other is a ghost to the average consumer, the Atlas recognizes them as the same thing: the high-stakes machinery that keeps the modern world running. One is noticed because of its global news cycle; the other is only noticed when the “mission-critical backbone” fails.
Conclusion
Understanding brand perception has always been one of the central challenges of marketing and brand strategy. In the digital era, the difficulty lies not in the absence of information but in its overwhelming abundance. Organizations now face a paradox: more data than ever before, yet less clarity about what it means.
The Brand Perception Atlas represents an effort to bring structure to this complexity. By integrating diverse perception signals, ranging from social media discourse to public narratives and LLM summaries, and anchoring them against the long-term ground truth of BAV brand equity data, the atlas makes it possible to observe how brand meaning evolves across different layers of public perception.
This unified view reveals something important: the signals surrounding a brand are not random noise. They form patterns. Brands cluster around shared emotional territories, compete in perceptual spaces that often cut across industry boundaries, and reveal whether social conversation reinforces or diverges from long-standing brand equity.
Rather than replacing traditional research methods, this approach extends them. It allows brand leaders to see not only what people say about brands today, but also how those conversations relate to the deeper beliefs that define brand meaning over time.
In a world where social media amplifies attention but does not always reshape perception, the real strategic advantage lies in understanding the relationship between visibility and meaning. The Brand Perception Atlas offers a way to navigate that relationship. Not as a replacement for human judgment, but as a new map, one that helps brand leaders see where their brand truly sits in the landscape of consumer perception, and how that landscape is changing.
Because in the end, the challenge is not simply measuring brand performance, it is understanding the territory of meaning that a brand occupies in people’s minds and learning how to navigate it.
Learn more about WPP Brand Asset Valuator® (BAV) and how you can access this data for your own analysis.
Leave a Reply