A short video walkthrough of the Atlas can be viewed below:
Video Walkthrough: Exploring the Brand Perception Atlas ⬇️
Introduction
A brand is not just what it says it is.
It is what people repeatedly, collectively, and emotionally decide it is.
In 2026, those decisions are happening everywhere: on Instagram, TikTok, in reviews, in news cycles, in comment sections, and in the accumulated memory of long-term brand equity.
For organizations attempting to understand brand perception, this environment presents a fundamental challenge. The volume of available data is unprecedented, yet the signals it produces are often inconsistent and contradictory. Traditional research tools such as surveys and focus groups remain essential for measuring brand equity, but they capture perception only at specific points in time and cannot fully reflect the fast-moving nature of digital conversation.
At the same time, social media offers a continuous stream of public commentary, revealing how brands are discussed, interpreted, and compared in everyday discourse. However, these signals are noisy and difficult to interpret in isolation.
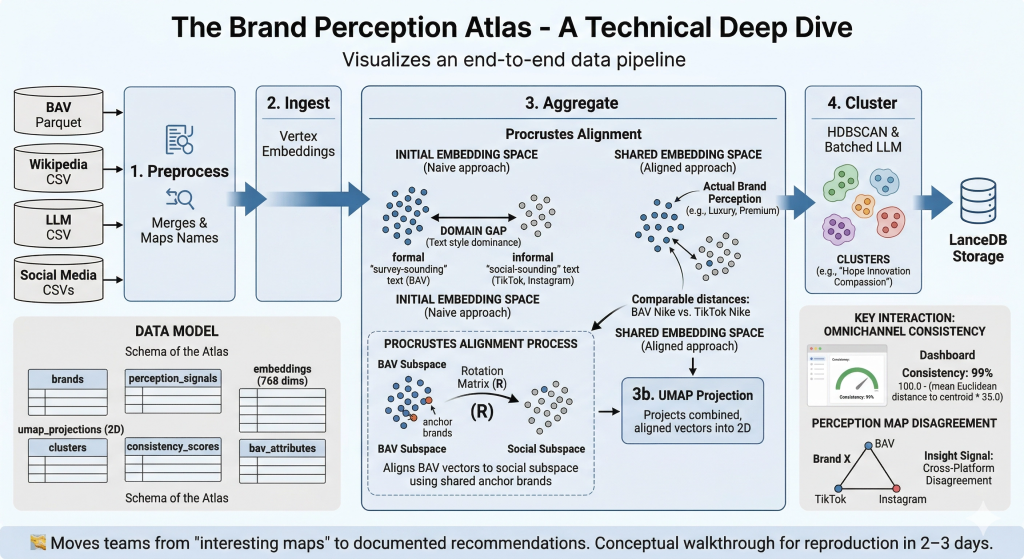
The Brand Perception Atlas was built to turn that noise into a map, designed to integrate diverse perception signals into a unified analytical framework. By combining social media data, public knowledge sources, Large Language Model (LLM) summaries, and established brand equity research, the Atlas aims to provide a more comprehensive understanding of how brands are perceived across the digital ecosystem.
The Brand Perception Atlas
The Brand Perception Atlas functions as a navigational system for brand strategy, much like a pilot relies on a map to understand the landscape below. From the cockpit, individual roads and buildings disappear. What matters is the wider pattern: landmarks, terrain, and relationships across the whole field.
Brand leaders face a similar challenge. A single post, review, or survey response reveals very little on its own. But when thousands of signals are mapped together, larger patterns come into view.
The Brand Perception Atlas turns those scattered signals into a shared perceptual map, showing how brands cluster, where they compete, and which meanings they occupy in the public imagination.
To achieve this, the Atlas synthesizes perception signals from several sources:
- Content from official brand accounts on platforms such as TikTok and Instagram
- Public narratives reflected in sources like Wikipedia
- AI-generated summaries, using Gemini, describing how brands are perceived in LLM-based discourse.
- To anchor the analysis in long-term brand perception, the system incorporates survey-based brand equity data from the WPP Brand Asset Valuator® (BAV).
BAV holds a special place among brand-perception sensors. Developed by WPP, BAV is one of world’s largest and longest-running brand equity studies, spanning more than three decades, thousands of brands, and multiple markets. Unlike social and digital signals, which infer perception from public behavior, BAV measures it directly by asking consumers what they believe. That makes it the *Atlas’*s anchor: not a snapshot of what people are saying today, but a benchmark for what they have come to believe over time.
BAV captures this through 48 standardized Imagery Attributes, from functional traits such as Reliable and High Quality to more emotional cues such as “Charming”, “Daring”, and “Sensuous”. In the Atlas, those attributes provide a high-resolution view of brand meaning, making it possible to see exactly which dimensions of perception define its underlying equity.
Table 1 presents samples from all Atlas sensors for two of the world’s most recognizable brands: Target and Airbnb. The table illustrates how the same brand can be perceived very differently across sensors, highlighting the need for a tool like the Brand Perception Atlas, which brings these diverse perspectives together into a single, contextualized view.
| Sample Brand Perception Reports #colspan# | ||
|---|---|---|
| Source | Target | Airbnb |
| **Survey (BAV) | ||
| (Long-term Equity)** | “Consumers perceive this brand as a highly accessible and dependable choice, offering excellent value for money. It consistently earns praise for its reliable, high-quality, and original offerings… Seen as a dynamic leader that stays up-to-date and trendy.” | “Perceived as a highly original, daring, and progressive leader in the travel space. It is seen as a ‘cool’ and ‘friendly’ brand that offers unique, high-quality experiences. It resonates with intelligent, socially responsible, and trendy individuals looking for an authentic vibe.” |
| **Wikipedia | ||
| (public narrative)** | “A major American retail chain… positioned as offering upscale products at below-average costs, appealing to a younger, more educated, and higher-income demographic… noted for its significant market presence.” | “A global platform for homestays and vacation rentals… credited with revolutionizing the ‘sharing economy.’ However, its narrative is often complicated by discussions regarding its impact on local housing markets, regulatory battles, and ‘overtourism’ in major cities.” |
| **Gemini LLM | ||
| (digital discourse)** | “Target cultivates an ‘upscale-for-less’ reputation… It’s perceived as a clean, organized, and pleasant one-stop-shop that blends everyday necessities with trendy, affordable finds.” | “Widely viewed as a pioneer of authentic, ‘live like a local’ travel. While praised for design and convenience, digital discourse often centers on the ‘Airbnb-ification’ of cities, rising service fees, and the shift from quirky spare rooms to professionalized rentals.” |
| (brand official account)** | “An accessible and enjoyable retail destination… The playful and organized presentation of shopping reinforces a positive, discovery-driven customer experience, emphasizing Target’s ability to host unique product lines.” | “A visually stunning showcase of ‘bucket-list’ stays and architectural marvels. The brand projects an aspirational yet community-focused vibe, emphasizing human connection, design-led travel, and the ‘Omg!’ category of unique homes.” |
| **TikTok | ||
| (brand official account)** | “Widely seen as a trendy, accessible retailer offering stylish, curated products and collaborations that enable a joyful lifestyle… captures a highly visual and energetic side of the brand.” | “Highly energetic and trend-focused, leaning into creator-led tours of unique properties. The vibe is one of discovery and adventure, making global travel feel personal and attainable through viral ‘hidden gem’ content.” |
Table 1: Sample brand perception reports, for Target and Airbnb, from the Brand Perception Atlas dataset
Core Brand Identity
When a focus brand is selected, the Atlas reveals its Core Brand Identity: a breakdown of the top perceptual themes by channel. This provides an at-a-glance view of what each sensor is saying about the brand, and where those signals align or diverge.
For example, selecting Adobe surfaces a clear identity profile. On BAV, the brand is perceived as Reliable, Innovative, and Intelligent. On Wikipedia, the dominant themes shift to Innovative, Dominant, and Controversial. Each sensor contributes a different angle, but together they reveal the full perceptual picture.
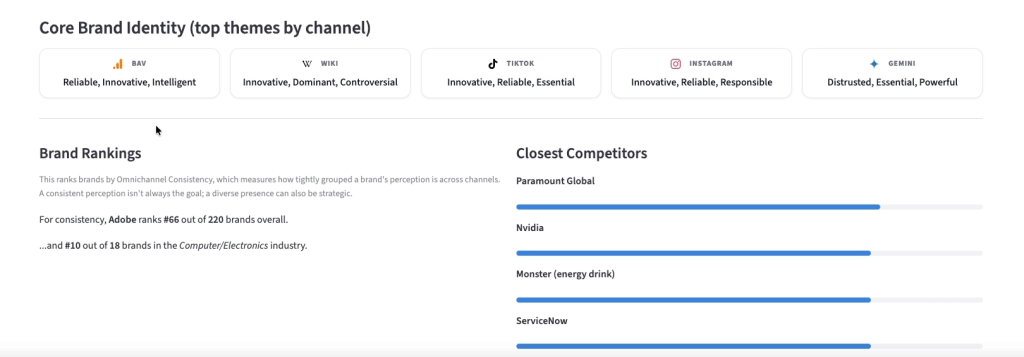
Figure 1: Screenshot of the Selected Brand’s Core Brand Identity
Mapping Brand Perception
At the center of the Atlas is the Perception Map, a visual representation of how brands relate to one another in terms of public perception.
Each perception signal is converted into a numerical representation of semantic meaning, known as an embedding. A helpful way to think about semantic meaning is as the “essence” of a word, rather than the word itself. For example, although “Luxury” and “High-end” are lexically different, they convey very similar meanings. The **Atlas uses semantic Gemini embeddings to capture these relationships and understand the semantic similarity between terms such as “Luxury,” “Premium,” “Prestigious,” and “High-End.” Because their meanings are closely related, the system places brands characterized by these words in the same neighborhood on the map.
The resulting map resembles a landscape of brand meaning, allowing brand leaders to identify clusters of brands that share common associations and spot outliers that occupy distinctive perceptual positions.
Omnichannel Consistency
Another of the most useful insights derived from the Atlas is a metric that we refer to as Omnichannel Consistency. This measure evaluates how closely aligned a brand’s perception is across different information sources. If the signals derived from social media, surveys, and public narratives cluster tightly together, the brand is communicating a consistent identity. Conversely, if these signals are widely dispersed, the brand’s presence is more diverse.
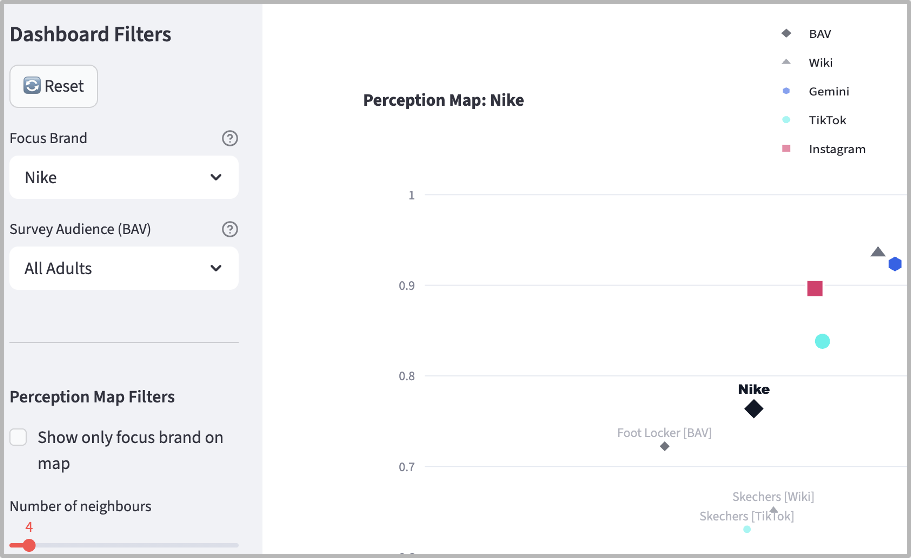
Analysis of the dataset identified several brands with exceptionally strong consistency across channels, including John Deere, Caterpillar, and Oscar Health, each showing more than 99% omnichannel consistency. John Deere is a clear example: its core perception of rugged reliability remains stable whether measured through a 30-year longitudinal BAV survey or reflected in viral TikTok videos. Figure 2 illustrates this pattern, with all John Deere signals appearing tightly clustered on the map.
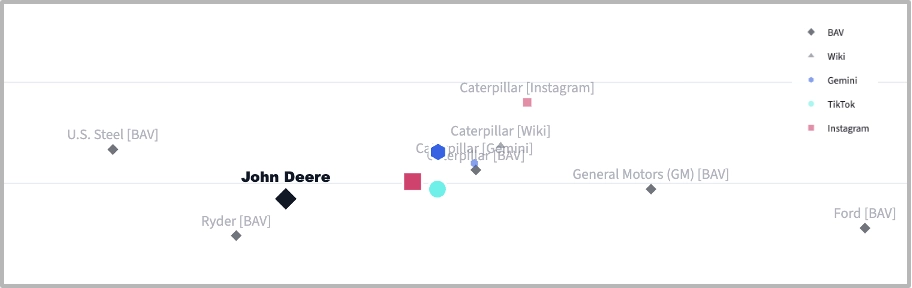
Figure 2: Perception map showing high omnichannel consistency for John Deere on all platforms (US, 2025-26). The BAV (black diamond), Instagram (red square), TikTok (light blue circle), Gemini (blue hex), and Wiki (gray triangle) sensors are all close to each other in the Perception Map.
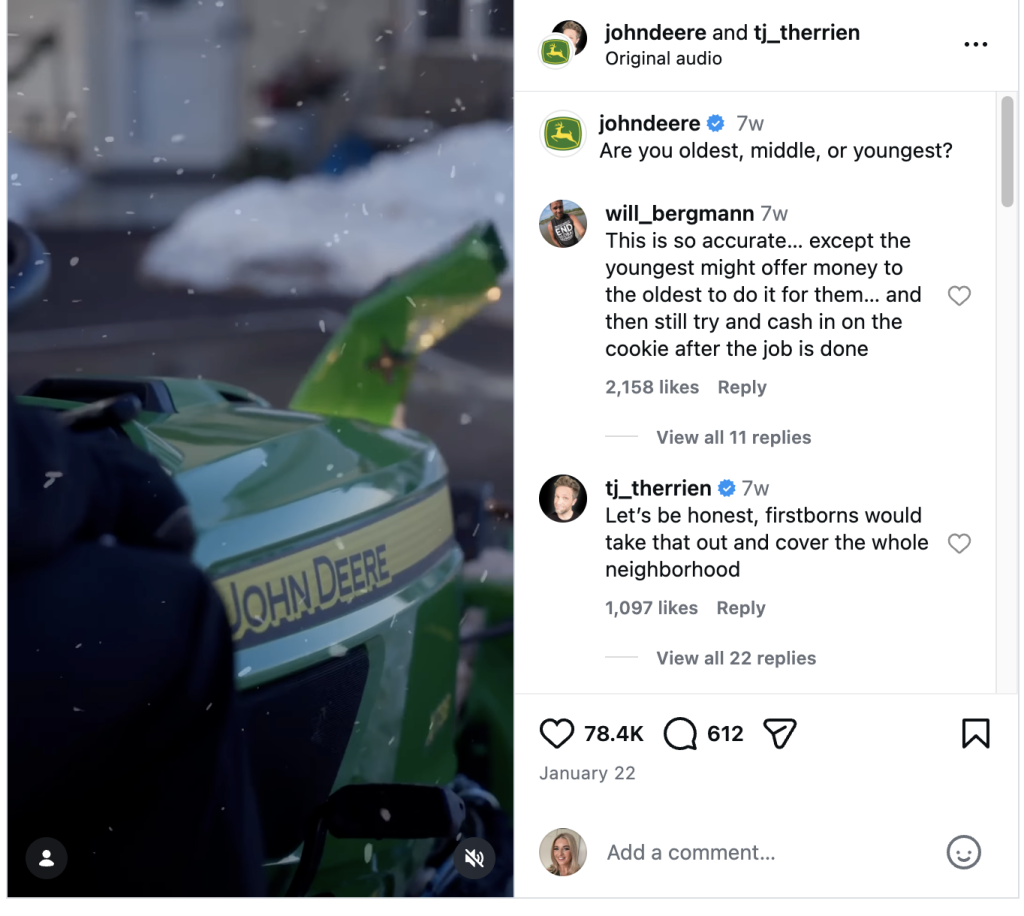
As shown in Figure 3, the brand’s digital content visualizes a bridge between historical heritage and modern utility. This alignment is not merely aesthetic but is deeply rooted in a consistent cross-platform narrative.
- On BAV, the brand is perceived as a “formidable and dependable leader,” successfully blending a “rugged” and “traditional” foundation with a “distinctively cool and stylish” upper-class appeal. It is consistently rated as a “best-in-class” choice that is “worth more,” signaling its status as a premium investment.
- On Gemini, the narrative reinforces this by projecting the “vibe of a legacy American icon built on reliability.” The discourse centers on the “durability and longevity” of the equipment, where the classic slogan “Nothing runs like a Deere” continues to underpin a reputation for high performance.
- On social sensors, the brand’s perception is characterized by “practical innovation”. Reports highlight a “strong brand affinity” built through “real-life customer stories centered around dedication and essential work.” While the content celebrates the “versatile and dependable” nature of the machinery for tasks like snow removal, it also reflects a modern tension: the high cost of entry and proprietary technology, which mirrors the BAV finding that the brand is perceived as a “significant investment.”
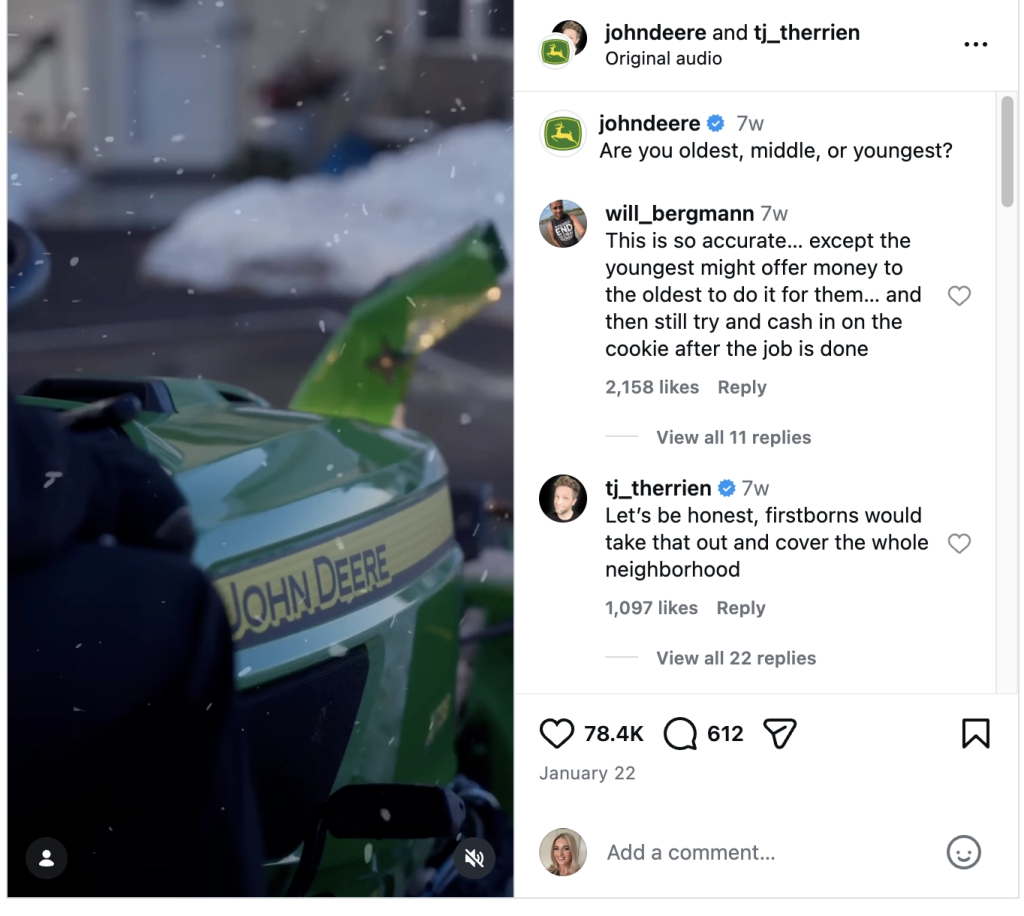
Figure 3: Screenshot of a John Deere Instagram video showing snow removal equipment
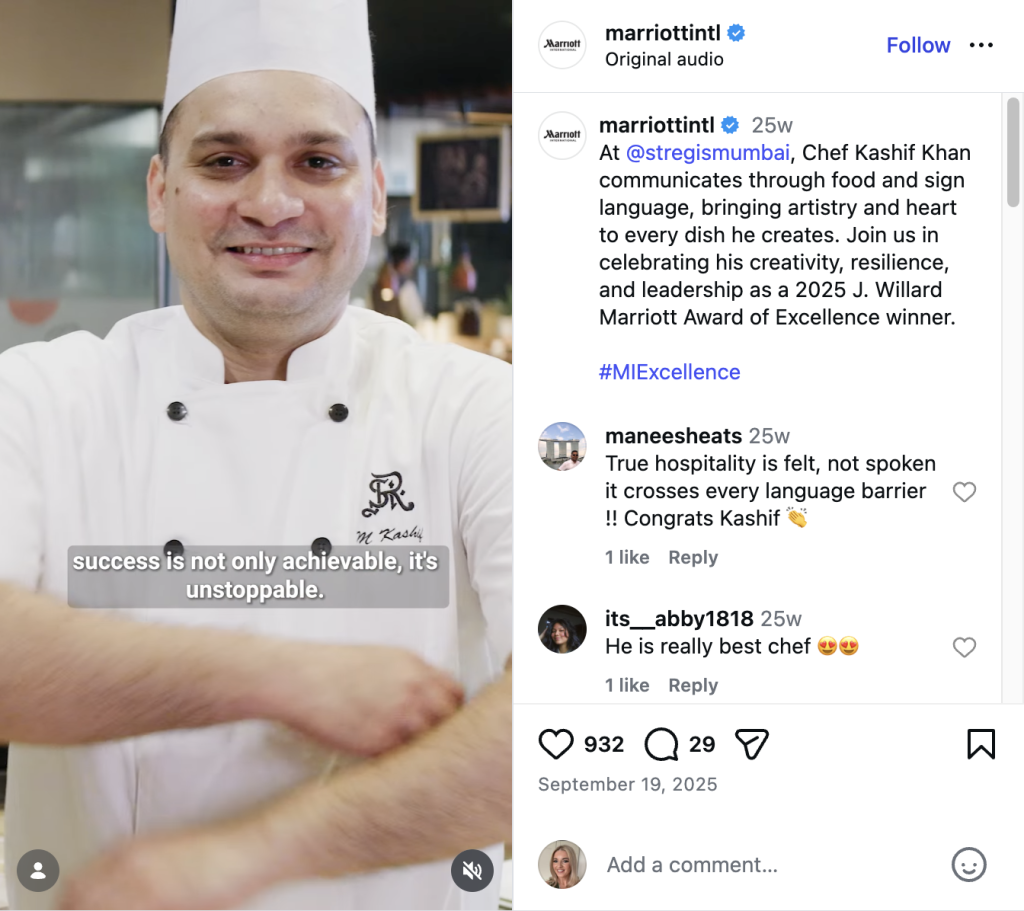
In contrast, several other brands demonstrated much greater variation in perception across sources. Marriott provides a compelling example of a multi-faceted brand that occupies distinct perceptual territories depending on the sensor used. As shown in Figure 4, the Atlas reveals a clear divergence in how the brand is categorized.
- The BAV sensor (bottom right in Figure 4) positions the brand within a territory of reliability, superior quality, and prestigious appeal, where consumers fundamentally view Marriott as an intelligent, high-performing, and traditional leader. BAV reports explicitly describe it as “a beacon of established excellence and prestige… commanding a perception of leadership and trustworthiness firmly rooted in tradition.”
- The social sensors (Instagram and TikTok, upper right corner in Figure 4), however, pull the brand into a separate region defined by aspirational luxury and curated escapism. In these digital spaces, Marriott’s intended portrayal is human-centric and inclusive, with official reports describing an organization that “champions individuals” and demonstrates “deep cultural understanding.”
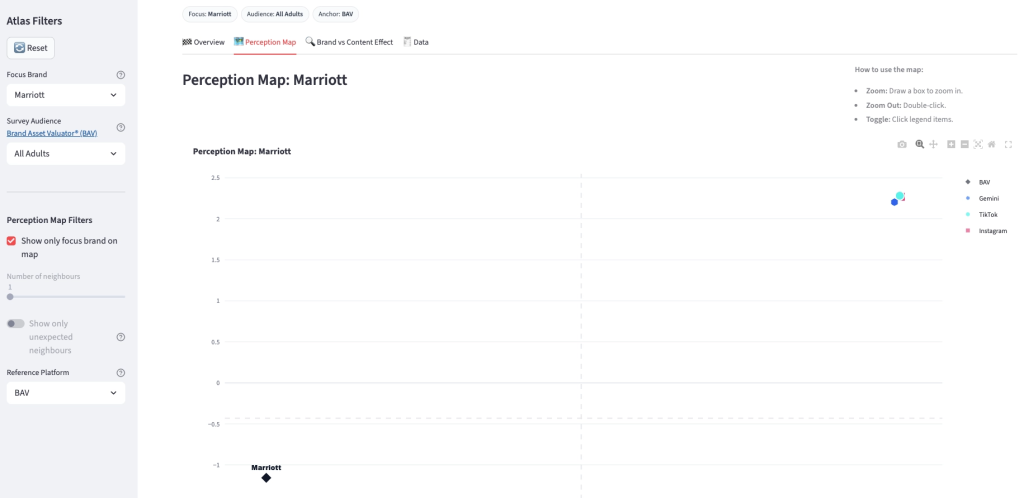
Figure 4: Screenshot of the Brand Perception Atlas showing the dispersed points of the Marriott
The variance in the data speaks to a brand successfully managing a legacy reputation while aggressively chasing a modern, inclusive digital identity (see Table 2).
| Sensor | Key Perceptual Snippet | Core Narrative |
|---|---|---|
| BAV | “This brand is primarily perceived as highly reliable… a beacon of established excellence and prestige. It commands a perception of leadership and trustworthiness firmly rooted in tradition.” | The Anchor: Focuses on dependability, classic excellence, and proven heritage. |
| “Marriott International… projects a vibe of inclusivity, reliability, and cultural understanding. Praised for its global reach, diverse workforce, and initiatives focused on social responsibility.” | The Bridge: Humanizes the giant; focuses on “people first” and cultural connectivity. | |
| TikTok | “Cultivates an aspirational and exclusive vibe… promoting global travel and luxury experiences… purveyor of curated escapism and wellness.” | The Future: Targets the frequent traveler seeking sophisticated, unique retreats and “Instagrammable” indulgence. |
Table 2: Sample brand perception text, for Marriott, from the Brand Perception Atlas dataset
Interestingly, multiple travel-related brands exhibited high dispersity across the semantic perception space. The high volume of online discussion surrounding travel experiences, ranging from positive stories to customer complaints, may contribute to a more fragmented perception environment for brands in this sector.
Omnichannel consistency is not inherently good or bad. Some brands benefit from a tightly aligned identity across platforms, while others thrive by expressing different facets of themselves in different contexts. In categories such as entertainment, fashion, and travel, more fragmented perception may reflect adaptability and cultural relevance rather than weakness.
For this reason, the consistency metric is diagnostic, not prescriptive. It shows where a brand sits on the spectrum between a unified and multi-faceted perception, helping leaders assess whether that pattern aligns with their strategy.
Shared Equity, Different Vibe (Close on BAV, Far on Socials)
The Atlas also reveals unexpected relationships between brands in completely different industries. One of the clearest patterns appears when two brands share a similar equity foundation but project very different identities on social media.
A good example is 3M and Marriott. At first glance, they are not intuitive neighbors. 3M is associated with science, engineering, and industrial innovation, while Marriott is associated with hospitality, travel, and aspirational leisure. On social media, they occupy very different cultural spaces, and in the Atlas’s social sensors they sit far apart.
| Source | 3M | Marriott |
|---|---|---|
| BAV | “Projects a vibe of rugged, energetic reliability combined with a visionary, original spirit… praised for its trustworthiness and distinctively high quality.” | “Perceived as superior quality and high-performing… described as unique, stylish, and authentically simple. Appeals to a sophisticated, aspirational lifestyle.” |
| Gemini | ||
| “Deeply divided: seen as a legacy American innovator of household staples, but its reputation is tarnished by high-profile legal and environmental controversies.” | “A vast corporate giant in hospitality. Reputation has a dual identity: a provider of aspirational luxury vs. an impersonal entity with inconsistent service.” | |
| “Science and technology powerhouse, praised for its problem-solving capabilities. Emphasizes STEM education and its role in enabling future technologies.” | “Cultivates a multifaceted image as a global provider known for community, sustainability, and inclusivity. Projects a vibe of reliability and cultural understanding.” |
Table 3: Sample brand perception reports, for 3M and Marriott, from the Brand Perception Atlas dataset
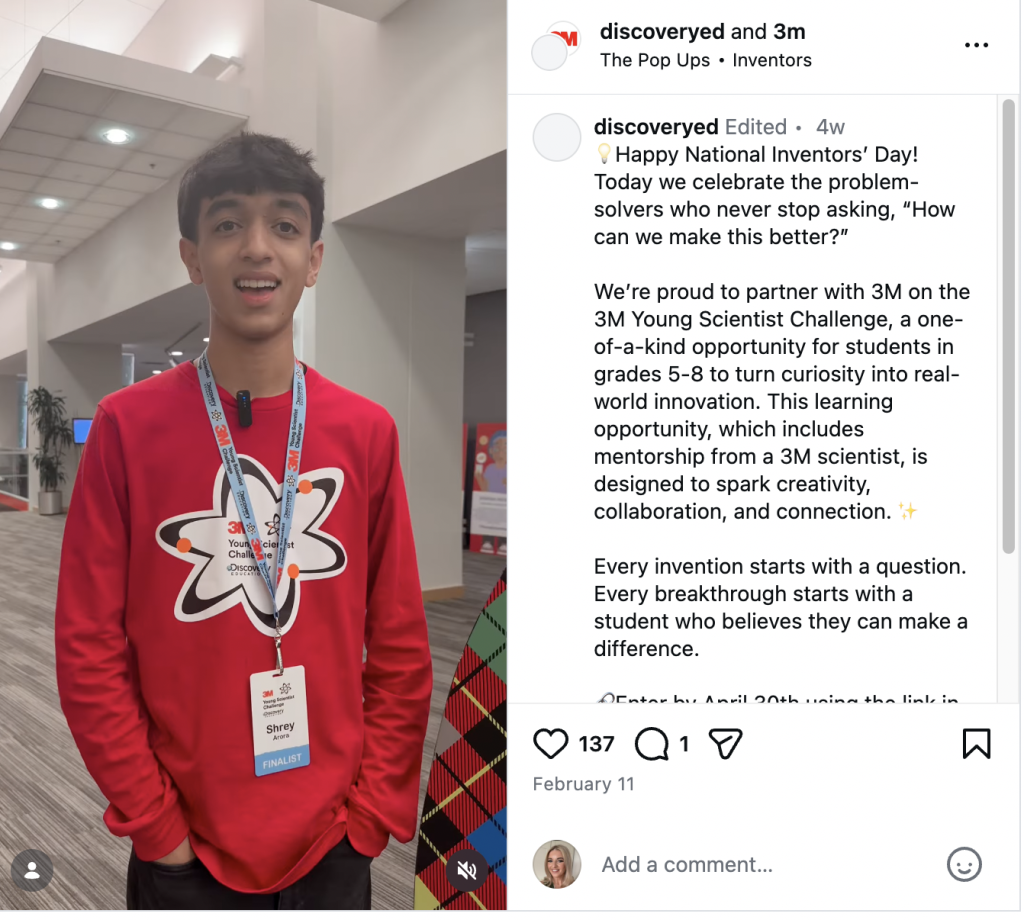
Figure 6 illustrates this dynamic for 3M. Content such as its Instagram posts around the Young Scientist Challenge creates a perception centered on innovation, education, and community. The brand appears inspiring, responsible, and forward-looking. This is very different from Marriott, whose social presence is shaped by luxury, travel, and experience.
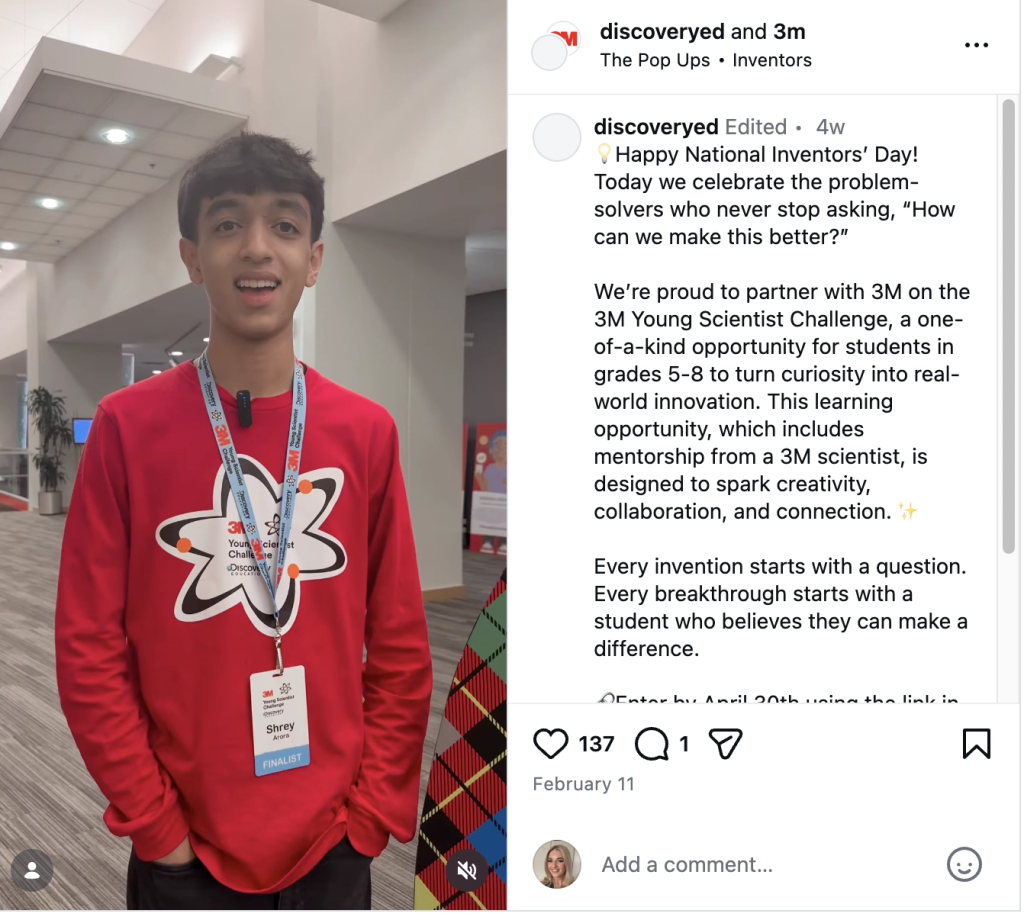
Figure 6: Screenshot of 3M Instagram video highlighting the Young Scientist Challenge
However, the BAV sensor tells a different story. At the level of deeper brand equity, 3M and Marriott emerge as close neighbors because both are anchored by reliability and leadership. In the consumer mind, 3M functions as an innovation backbone, while Marriott functions as a service backbone. Their social expressions differ, but their underlying equity plays a similar emotional role: both are seen as dependable institutions.
A similar pattern appears with Costco and JetBlue, as shown in Table 4. These brands belong to very different categories, yet on the BAV sensor they appear close together within a shared “consumer champion” territory. Both brands are anchored by associations such as friendliness and reliability. Costco is strongly linked to simplicity, while JetBlue is associated with value. At a foundational level, both occupy a similar emotional space: trusted brands that provide essential services without the friction consumers often expect from their industries.
| Source | Costco | JetBlue |
|---|---|---|
| BAV | “Predominantly perceived as high-value, reliable, and authentic… offers helpful and intelligent solutions while demonstrating a commitment to equality.” | “Largely perceived as fun, cool, and friendly… valued for its distinctiveness and high quality, contributing to a perception of being trendy and energetic.” |
| Wikipedia | ||
| “A highly successful, global membership-only warehouse club known for its value and its strong ‘Kirkland Signature’ private label.” | “A hybrid low-cost carrier that disrupted the airline industry with premium amenities. Recently faced scrutiny over alliances and operational reliability.” | |
| Gemini | ||
| “Widely perceived as a members-only ‘treasure hunt,’ fostering a cult-like loyalty. Praised for unbeatable value, but criticized for a chaotic in-store experience.” | “A trendy, modern airline struggling to live up to its reputation. While the in-flight experience is praised, operational reliability is a significant pain point.” | |
| “Beloved, value-driven club offering a unique shopping experience. Transformed mundane shopping into a leisure activity and shareable ‘Costco haul’ content.” | “Projects a customer-centric and approachable vibe. Highlights above-average amenities and playful brand interactions compared to typical budget carriers.” |
Table 4: Sample brand perception reports, for Costco and JetBlue, from the Brand Perception Atlas dataset
This pattern is diagnostically useful, as it shows that brands can share the same equity backbone while expressing themselves very differently across platforms. Costco doubles down on functional value, while JetBlue leans into aspiration and lifestyle.
Different categories. Different content. Same emotional job.
Different Equity, Shared Vibe (Far on BAV, Close on Socials)
The Atlas also reveals brands that follow the opposite pattern: brands from very different industries that share little underlying equity, yet converge into a similar “vibe” on social media. In these cases, the social layer acts as a cultural blender, pulling very different brands into the same perceptual neighborhood.
A strong example is General Mills and Smucker’s. At the level of long-term brand equity, these brands occupy distinct positions, as shown in Figure 7. General Mills is perceived as a “highly reliable, high-performance leader” whose vibe blends “traditional prestige” with a “glamorous and daring appeal.” Smucker’s, by contrast, is seen as an “original and unique leader” that fuses a “traditional foundation with a trendy, cool, and dynamic aesthetic,” praised for its “rugged appeal and fun character.”
According to the BAV sensor, while both are established food brands, they occupy meaningfully different perceptual territories: General Mills anchored in prestige and reliability, Smucker’s in originality and rugged charm.
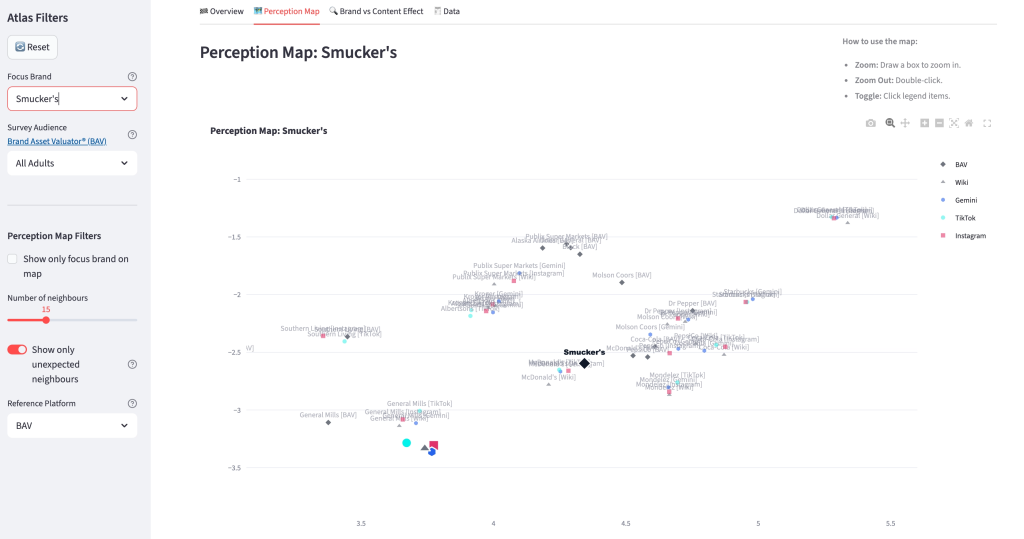
Figure 7: Screenshot of the Brand Perception Atlas showing the focus brand, Smuckers, and proximity to General Mills
Yet on social media, the distinction between them fades. On Instagram and TikTok, both brands converge into a shared neighborhood of nostalgic comfort and family-friendly Americana.
According to these social sensors, General Mills “cultivates a vibe of reliable convenience and family-friendly nostalgia,” engaging audiences with creative recipe ideas rooted in American food culture. Smucker’s similarly “evokes a strong sense of nostalgic comfort and reliable quality,” projecting tradition, community, and corporate social responsibility. On social platforms, both brands occupy the same emotional space: trusted pantry staples working to stay relevant with modern, health-conscious consumers.
| Source | General Mills | Smucker’s |
|---|---|---|
| BAV | “Perceived as a highly reliable, high-performance leader offering exceptional quality. Its vibe is one of traditional prestige blended with a glamorous and daring appeal, reflecting an intelligent and customer-caring image.” | “Widely perceived as an original and unique leader, skillfully blending a traditional foundation with a trendy, cool, and dynamic aesthetic. Praised for its high quality, rugged appeal, and fun character.” |
| Wikipedia | ||
| “A long-standing American multinational food manufacturer with a diverse portfolio (Cheerios, Pillsbury). Focused on expanding health-conscious offerings and sustainability, though it has faced scrutiny over legal terms and health claims.” | “A long-established and highly diversified American food and beverage manufacturer (Folgers, Jif). Known for an aggressive acquisition strategy that has transformed it into a Fortune 500 company with a broad portfolio.” | |
| Gemini LLM | “Widely perceived as a dependable, nostalgic American staple increasingly viewed through a lens of corporate scrutiny. Discussions often focus on high sugar content and the ‘shrinkflation’ of its iconic cereal brands.” | “Quintessential American heritage brand evoking nostalgia and comfort. While loyalty is built on consistent taste, the brand’s reputation has been challenged by major product recalls and concerns over nutritional value.” |
| “Cultivates a vibe of reliable convenience and family-friendly nostalgia. Engages a wide audience with creative recipe ideas while facing criticism regarding the nutritional content of its processed foods.” | “Projects a vibe of a reputable company with an emphasis on tradition and community. Praised for its deep-rooted history and significant corporate social responsibility initiatives, including sustainability advancements.” | |
| TikTok | ||
| “Presents a comfortable, family-friendly image rooted in American food culture. Struggles to fully resonate with health-conscious consumers due to a perception of limited innovation in its core processed staples.” | “Evokes a strong sense of nostalgic comfort and reliable quality. Working to engage younger audiences by promoting modern, sustainable practices and creative usage of its familiar pantry staples.” |
Table 5: Sample brand perception reports, for General Mills and Smuckers, from the Brand Perception Atlas dataset
In this digital layer, General Mills‘ recipe-driven content and Smucker’s‘ heritage-focused storytelling occupy the same neighborhood. They are no longer distinguished by their different equity profiles; instead, they are unified as Nostalgic American Pantry Brands that use family-friendly content and tradition to build emotional resonance with their audiences.
Conclusion
Understanding brand perception has always been a central challenge in marketing and brand strategy. In the digital era, the challenge is no longer a lack of information, but an excess of it. Organizations now face a paradox: more data than ever, yet less clarity about what it actually means.
In a world where social media amplifies attention without always reshaping perception, the real strategic advantage lies in understanding the gap between visibility and meaning. The Brand Perception Atlas makes that gap visible. It shows where brands cluster, where they drift, and where surface-level conversation either reinforces or obscures deeper brand equity. In doing so, it helps brand leaders understand not just what people are saying today, but how those conversations connect to the deeper beliefs that shape brand meaning over time.
The real challenge is not simply tracking what a brand did yesterday. It is understanding what that brand means, what territory it occupies in people’s minds, and how difficult that territory is to shift.