TL;DR Most tools that claim to predict post performance tell you what’s in a post — they can’t tell you why it would resonate. The Prediction Optimization Agent closes that gap by using a reasoning LLM to convert diverse multimodal inputs — images, captions, metadata — into a single natural-language description that captures tone, credibility, and visual cohesion the way a strategist would. Instead of hand-engineering rigid features like brightness or face detection, the agent extracts higher-level concepts like humor, urgency, and brand fit that traditional pipelines structurally cannot. That description becomes the feature set for a downstream predictive model, continuously refined by an autonomous optimizer that treats the prompt as a tunable parameter — iteratively rewriting it based on prediction error until it converges on the description that best explains real engagement outcomes. The result is a system that doesn’t just predict what will perform, but allows creative teams to draw insights on what makes a post tick — and what doesn’t.
The Performance Optimization Agent: Technical Pipeline and Evaluation
- Repo: link
Introduction
Predicting the engagement of social media content before publication is a high-value problem across marketing, advertising, and platform analytics. The challenge is inherently multimodal: a single Instagram post combines visual content (composition, lighting, subjects), caption text (tone, humor, calls-to-action), and structured metadata (follower count, posting time, influencer category)—and engagement is driven not by any one signal in isolation, but by the interaction between them. Traditional approaches attempt to handle this by stitching together separate computer vision, NLP, and tabular models, then fusing their outputs. But this siloed architecture is structurally unable to capture cross-modal semantics—humor that arises from the interplay of image and caption, or credibility that depends on the match between an influencer’s niche and the product they endorse.
This report presents the technical implementation and experimental evaluation of the Prediction Optimization Agent, an agentic system that addresses this limitation through a single unifying mechanism: semantic translation. Rather than training an end-to-end multimodal model, the agent uses a multimodal LLM to convert each post—image, caption, and metadata together—into a structured natural-language description. A lightweight downstream model then predicts engagement from that text alone. Critically, the translation prompt is not static: an LLM-based optimizer iteratively rewrites it using quantitative prediction error as its signal, treating the prompt as a tunable hyperparameter that converges toward descriptions maximally predictive of real engagement outcomes.
For a fuller discussion of the business motivation, use cases, and strategic implications of this approach, we refer the reader to the accompanying blog post. The remainder of this document focuses on the system architecture, cloud infrastructure, dataset preparation, experimental methodology, and quantitative results.
Cloud Architecture & Technical Implementation
This technical report details the specific technical implementation relies on a scalable cloud architecture:
- Semantic Translation: A Multimodal LLM (e.g., Gemini, GPT, Claude) ingests the media. To process large volumes of posts efficiently during each optimization round, the pipeline utilizes Vertex AI Batch Predictions. The system prompt directs the model to extract specific features to output a rich, structured text document.
- Engagement Predictor: A lightweight, text-only Language Model is trained on these generated descriptions. It outputs a performance probability score and validation metrics.
- Self-Optimizer: An LLM agent analyzes the validation results, comparing the current prompt against error analysis data, and rewrites the System Prompt to be more effective.
Summary of Workflow:
- Initialize: Start with a generic prompt (“Describe this ad”).
- Translate: Convert media to text using the current prompt.
- Train: Train the text classifier/regressor.
- Evaluate: Measure accuracy.
- Refine: The agent updates the prompt to extract better predictive features.
- Repeat: Loop until performance plateaus.
Dataset
Dataset overview
We utilized the Instagram Influencer Dataset to extract text descriptions of posts and predict engagement metrics (such as the number of likes).
- Type: Category classification and regression.
- Description: This dataset contains 33,935 Instagram influencers categorized into nine domains: beauty, family, fashion, fitness, food, interior, pet, travel, and other. It features 300 posts per influencer, totaling roughly 10.18 million posts.
- Structure: Post metadata is stored in JSON format (caption, user tags, hashtags, timestamp, sponsorship status, likes, comments). The image files are in JPEG format. Because a single post can contain multiple images, the dataset provides a JSON-to-Image mapping file to link metadata with its corresponding visual assets.
Exploratory Data Analysis (EDA)
To better understand the target variables for our Predictor engine, we conducted a rigorous EDA on the dataset, revealing several key structural behaviors:
- Visualizing the Distribution of Likes: When visualizing the distribution of likes across the dataset, we observed a massive right-skew. The average (mean) post receives ~4,344 likes, but the median is only 662. Because of this severe, exponential variance, we cannot perform regression directly on the raw number of likes. Instead, the target variable must be transformed using log(likes + 1) to normalize the distribution, stabilize the variance, and ensure our regression model can learn effectively.
- Likes vs. Followers Correlation: The scatter plot distributions show a strong positive correlation (0.7853) between an influencer’s follower count and the number of likes they receive.
- **Engagement Rate Baseline:**We calculated the Engagement Rate (Likes / Followers * 100). The dataset shows a mean engagement rate of 4.23% and a median of 2.96%.
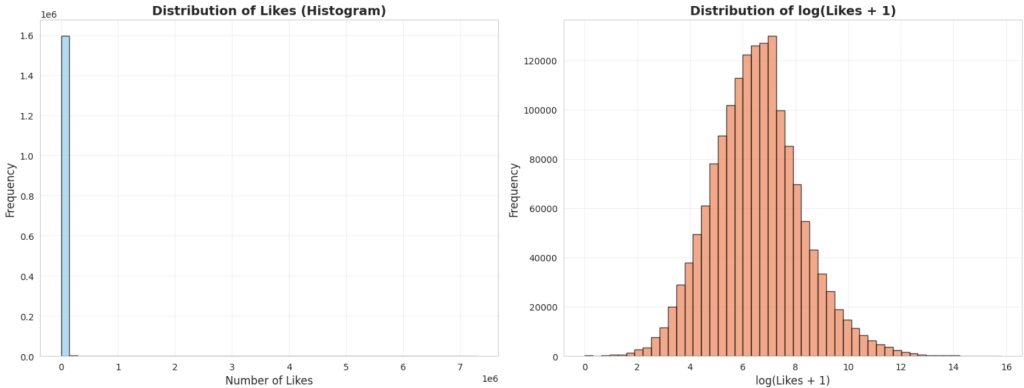
Figure 1. Histogram of number of likes and log of number of likes.
Results
Data Preparation
To ensure the integrity of our predictive modeling, we first applied filters based on our EDA. Roughly 13.8% of the dataset contained sponsored labels. We removed these sponsored posts entirely, as financial backing artificially skews organic engagement rates. We then narrowed our focus to create two high-density subsets: one featuring posts from the top 20 influencers, and a larger subset featuring the top 100 influencers (minimum 100 posts each). We opted to use the top 20 influences dataset in most of our experiments.
To handle the computational load of the iterative prompt optimization, we built a scalable cloud pipeline. Raw images and post metadata were staged in GCP Buckets. Gemini 2.5 Flash was deployed as the Semantic Translator to generate the text profiles, capturing both general post context and specific image content. Because the agentic loop required regenerating descriptions for thousands of posts across multiple prompt iterations, we leveraged Google Batch Predictions. This allowed us to asynchronously and cost-effectively generate the text profiles for each optimization round. Finally, the poster’s profile description, bio, and category were appended to the end of each generated description to provide complete semantic context for the downstream classifier.
Experiment 1: Comparative Baseline Analysis & Model Selection
We initially framed the problem as a 3-class classification task (predicting low, average, and high likes) using a custom Deep Neural Network (three Linear layers with ReLU activation, and Cross-Entropy Loss). However, results showed that treating the problem as a regression task on the log(likes + 1) target, yielded significantly better, more granular predictive performance.
For the regression task, we benchmarked three models:
- XGBoost Regressor: (n_estimators=300, learning_rate=0.05, max_depth=6, subsample=0.8)
- LightGBM Regressor: (n_estimators=300, learning_rate=0.05, max_depth=6, num_leaves=31)
- Transformer Model: distilbert-base-uncased, fine-tuned end-to-end.
For XGBoost and LightGBM, the text embeddings were calculated using the all-mpnet-base-v2 text embedding model.
| Model | R2 | MAE | RMSE |
|---|---|---|---|
| XGBoost | 0.6908 | 0.4184 | 0.5759 |
| LightGBM | 0.5749 | 0.5084 | 0.6752 |
| distilbert-base-uncased | 0.7925 | 0.3775 | 0.4804 |
Table 1: Results on the regression task, using History-Based Optimization
The fine-tuned DistilBERT model substantially outperforms both tree-based baselines, achieving an R² of 0.7925—a 10-point improvement, using History-Based Optimization, over XGBoost and a 22-point improvement over LightGBM. This gap is expected: DistilBERT processes the raw text descriptions end-to-end and can learn task-specific token-level interactions, whereas XGBoost and LightGBM operate on pre-computed embedding vectors that compress away some of this nuance. Among the tree-based models, XGBoost’s clear advantage over LightGBM (R² 0.69 vs. 0.57) suggests that it better captures the nonlinear relationships present in the embedding feature space. Notably, even the XGBoost pipeline achieves a reasonably strong R² of 0.69, indicating that the semantic descriptions generated by the translator carry substantial predictive signal regardless of the downstream model.
Given the trade-off between training cost and accuracy, we carried both XGBoost (as a fast, interpretable baseline) and DistilBERT (as the top performer) forward into the prompt optimization experiments, omitting LightGBM entirely.
Experiment 2: Iterative Prompt Optimization Strategies
Using the Top-20 influencer subset, we tested two distinct agentic prompt optimization approaches to see which method helped the LLM extract the most predictive features:
- History-Based Optimization: The agent was provided with the prompt history alongside the actual regression metrics (R2, MAE, RMSE) from previous iterations. The prompt instructed the LLM to deduce how to improve feature extraction based on these hard metrics.
- Google Few-Shot Prompt Optimizer: Utilizing Vertex AI’s Few-Shot Optimizer, the agent was provided with 20 “good” and 20 “bad” prediction examples from the prior iteration. The optimization rubric was defined strictly as: [“Acceptable prediction error”, “Absolute prediction error value”].
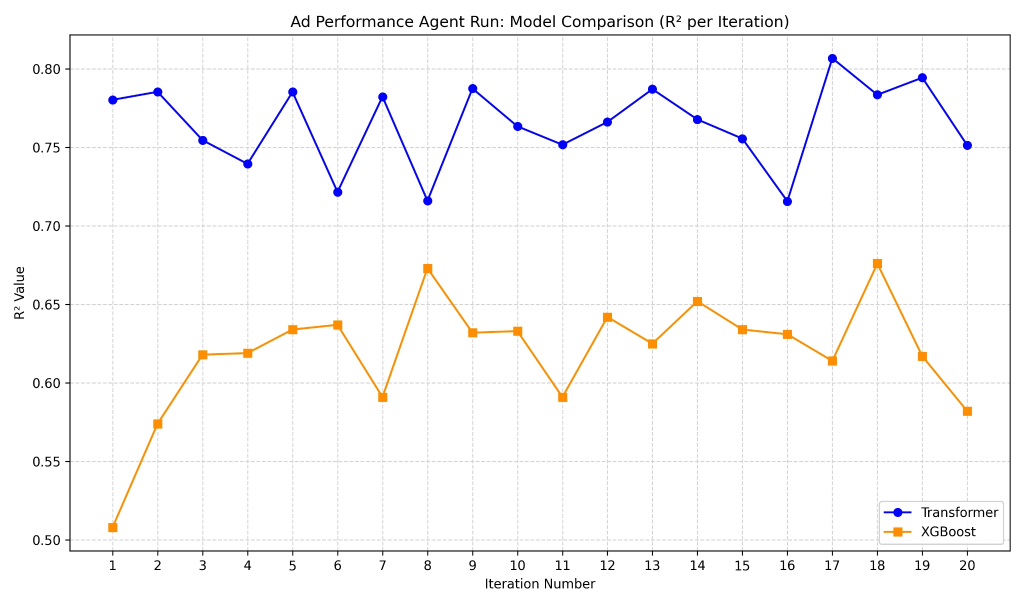
Figure 2: R2 value across 20 prompt optimization rounds using the Few-Shot prompt optimization strategy.
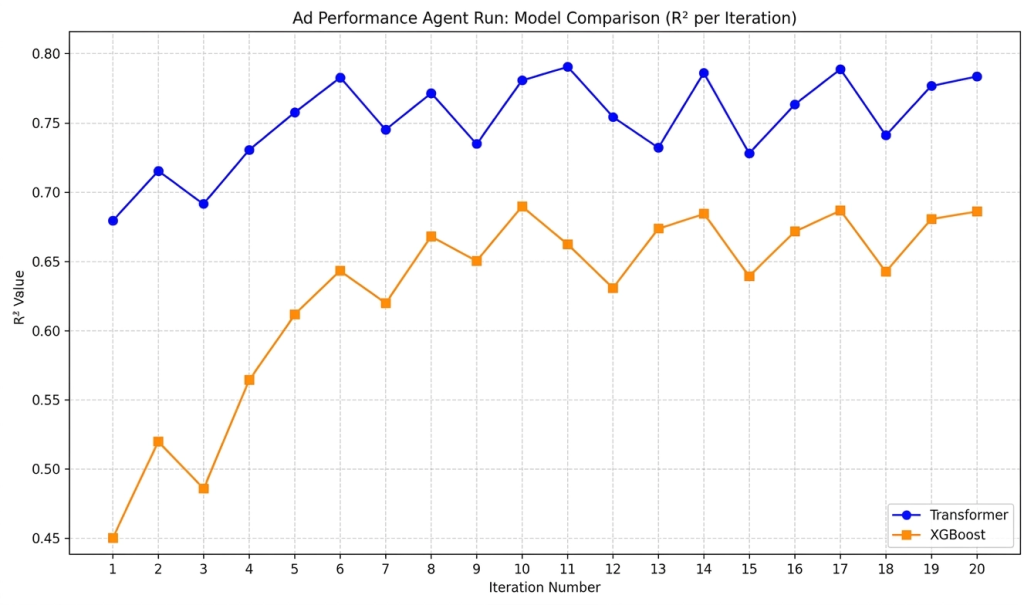
Figure 3: R2 value across 20 prompt optimization rounds using the History-Based optimization strategy.
| Prompt Optimization Strategy | Model | R2 | MAE | RMSE |
|---|---|---|---|---|
| History-Based Optimization | XGBoost | 0.6908 | 0.4184 | 0.5759 |
| distilbert-base-uncased | 0.7925 | 0.3775 | 0.4804 | |
| Google Few-Shot Prompt Optimizer | XGBoost | 0.6763 | 0.4691 | 0.6113 |
| distilbert-base-uncased | 0.8068 | 0.3463 | 0.4544 |
Table 2: Quantitative evaluation of prompt optimization strategies on the regression task
The convergence plot for the Few-Shot Optimizer illustrates the strategy’s core limitation: without access to the full optimization history, the agent has no memory of what has already been tried. For example, the XGBoost R² oscillates erratically across the 20 rounds—rising above 0.68 in one iteration, then dropping back below 0.60 in the next—because the optimizer can only react to the most recent batch of good and bad examples rather than reason over long-term trends. In contrast, the History-Based strategy converges more steadily under the same XGBoost evaluation setup, as the agent can trace which specific prompt changes improved or degraded each error metric across all prior rounds and avoid regressing to previously failed formulations.
Across both History-Based Optimization and the Google Few-Shot Prompt Optimizer, DistilBERT consistently outperforms XGBoost on all three evaluation metrics, achieving higher R² as well as lower MAE and RMSE. One plausible explanation is that DistilBERT benefits from end-to-end fine-tuning directly on the textual descriptions, allowing it to learn task-specific semantic patterns from the input. XGBoost, in contrast, depends on fixed upstream representations and therefore has less ability to adapt to nuance in wording, context, and structure. As a result, the Transformer-based approach appears better able to extract predictive signal from the generated descriptions than the tree-based regression pipeline.
Temperature Benchmarks
We tested different model temperatures using Gemini-2.5-Flash for text description generation (Semantic Translation) and Gemini-3.0-Pro for prompt optimization (Self-Optimization). The table below reflects temperature adjustments for the text generation phase, with XGBoost as the downstream regressor.
| Temperature | R2 | MAE | RMSE |
|---|---|---|---|
| 0.2 | 0.6577 | 0.4392 | 0.5746 |
| 0.4 | 0.6908 | 0.4184 | 0.5759 |
| 0.6 | 0.5765 | 0.5174 | 0.6933 |
| 0.8 | 0.5911 | 0.5008 | 0.6622 |
| 1.0 | 0.5852 | 0.5243 | 0.6825 |
Table 3: Performance degrades noticeably at temperatures ≥ 0.6, suggesting lower/moderate temperature for description generation leads to more consistent, predictive descriptions.
A temperature of 0.4 yields the strongest results, achieving the highest R² (0.6908) with competitive MAE. Performance degrades noticeably at 0.6 and above, with R² dropping by as much as 0.11 points. This is consistent with expectations: higher temperatures introduce hallucinated or loosely grounded details that add noise rather than predictive signal to the generated descriptions. When the downstream regressor encounters inconsistent or fabricated features across similar posts, its ability to learn stable patterns deteriorates. Conversely, the lowest temperature tested (0.2) underperforms 0.4, likely because overly deterministic outputs produce near-identical phrasing for visually similar but distinct posts, collapsing meaningful variation that the predictor could otherwise exploit. The sweet spot at 0.4 balances descriptive consistency with enough variation to differentiate posts along dimensions that matter for engagement. Based on these results, we fixed the Semantic Translation temperature at 0.4 for all subsequent experiments
Embedding Model Benchmarking
We additionally conducted an experiment to find the optimal text embedding model. We vectorized the generated descriptions (2,677 in total) using several popular embedding architectures and measured the downstream XGBoost regression performance.
| Embedding Model | Dimension | R2 Score | MAE | RMSE |
|---|---|---|---|---|
| thenlper/gte-base | 768 | 0.7372 | 0.4044 | 0.5308 |
| thenlper/gte-large | 1024 | 0.7165 | 0.4100 | 0.5513 |
| sentence-transformers/gtr-t5-large | 768 | 0.7122 | 0.4179 | 0.5554 |
| all-mpnet-base-v2 | 768 | 0.6908 | 0.4184 | 0.5759 |
| all-MiniLM-L12-v2 | 384 | 0.6273 | 0.4775 | 0.6322 |
| all-MiniLM-L6-v2 | 384 | 0.5594 | 0.4996 | 0.6874 |
| all-roberta-large-v1 | 1024 | 0.5520 | 0.5198 | 0.6931 |
Table 4: Evaluation of different embedding models on the regression task, using XGBoost model.
Three key findings emerge from the embedding benchmark. First, dimensionality alone is not predictive of downstream quality. The 1024-dimensional all-roberta-large-v1 ranks last (R² 0.5520), while the 768-dimensional gte-base leads the table (R² 0.7372), demonstrating that the training objective and data composition of the embedding model matter far more than raw vector size for this text domain.
Second, a clear performance tier structure is visible. The GTE family and gtr-t5-large form a top tier (R² > 0.71), while the MiniLM variants and RoBERTa fall noticeably behind (R² < 0.63). The top-tier models share a common trait: they were trained with contrastive objectives on diverse, semantically rich corpora, which aligns well with the structured but descriptive text our Semantic Translator produces.
Third, the 384-dimensional MiniLM models, while attractive for latency-sensitive deployments, lose a substantial amount of signal—an R² drop of 0.11 to 0.18 compared to gte-base. Their smaller embedding dimensions and shallower architectures lack the capacity to encode the dense, multi-attribute descriptions our Semantic Translator produces, where a single paragraph may simultaneously capture visual composition, emotional tone, brand cohesion, and influencer credibility.
Conclusion
This project demonstrates a highly effective, interpretable alternative to traditional opaque multimodal models for predicting media performance. By leveraging Large Language Models as universal feature extractors (the Performance Optimization Agent), we successfully unified heterogeneous data inputs into a single, human-readable semantic modality.
Several key insights emerged from our experimental pipeline:
- Target Transformation is Crucial: Predicting raw engagement metrics directly might inherently lead to faulty predictions due to label skewness. Transforming the target variable to log(likes + 1) and framing the problem as a continuous regression task yielded superior and more granular results compared to our baseline classification approach.
- Prompt Optimization Strategy: In our agentic optimization loop, History-Based Optimization was more suitable for the task at hand . Explicitly feeding the LLM agent hard quantitative error metrics (R2, MAE, RMSE) from previous iterations allowed it to reason more effectively about feature importance. It successfully “learned” to rewrite prompts that extracted visual and semantic elements highly correlated with user engagement.
- Embedding Efficiency Over Size: Our benchmarking revealed that bigger isn’t always better. The thenlper/gte-base model (768 dimensions) achieved the highest predictive performance (R2: 0.7372), outperforming significantly heavier models like gte-large and all-roberta-large-v1. This highlights that for this specific text space, highly optimized, mid-sized embeddings offer the best linear separability for tree-based regressors like XGBoost.
Ultimately, this agentic feedback loop proves that natural language prompts can be treated as tunable hyperparameters. This architecture not only predicts media success with strong accuracy but, more importantly, provides the crucial “why” behind the prediction—giving marketers and engineers the transparency that traditional approaches lack.